Pairviewer
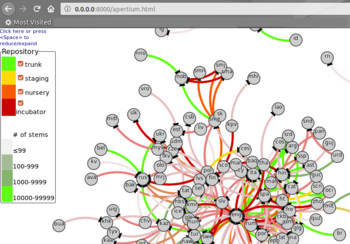
The Apertium Pairviewer is a HTML5/D3.js tool that depicts all Apertium language pairs in an interactive graph initially developed sometime before the Google Code-In 2013. Its source code can be found on GitHub and an online demonstration is available here.
The Global-Pairviewer is an implementation of Pairviewer with a three-dimensional globe. See this.
Contents
Setting up Pairviewer locally
Clone the git repository
Enter into the folder you want it to be in and download the whole program by running
git clone https://github.com/apertium/pairviewer.git
Set up a localhost with Python
You need to set up a localhost server before you can locally run Pairviewer.
First, check whether you have Python installed on your system and if so, what version(s) it is. Install preferably the latest one (Python 3) if it had not been done already.
python -v
Then make sure to enter the folder of the git repository you have cloned.
If you have is Python 3, run:
python3 -m http.server
Otherwise, if you do have Python 2, run:
python -m SimpleHTTPServer
You should see something like this on your terminal window.
Serving HTTP on 0.0.0.0 port 8000 (http://0.0.0.0:8000/)
Open on browser
Type localhost:80000/apertium.html into your browser's address bar and go.
This should successfully launch the Pairviewer. This step requires downloading some D3.js resources, so if your internet connection is slow, this might take a while.
Using Pairviewer
Updating language data by scraping
Apertium language data are being continuously developed, so it is highly possible that the language data that your Pairviewer were shipped with isn't up to date.
To scrap new language data (from Apertium's GitHub), run:
python3 scrape_repo_information.py
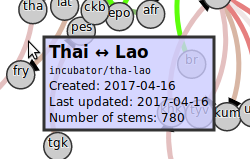
Hovering over a graph edge (language pair line) displays its language pair name, repository name, creation date, date of last update, and stem count.
The nodes (circles representing the languages) can be dragged around to rotate or move the entire graph.
Stats for the number of languages and language pairs represented in the graph can be found in the bottom-left corner.
Typing anything will produce a search box in the bottom right. Ctrl+F (find in page) can also be used for search.
The collapsible menu on the top left lets you filter languages according to its:
- progress stage (trunk, staging, nursery, or incubator)
- directionality (unidirectional, bidirectional, and direction missing)
- stem count (correlated with dictionary size)
- creation date
- date of last update
How Pairviewer works
The Pairviewer is made of nine components:
- apertium.css
- Styling for the whole application, including e.g. configuration for interactive graph edge/line width.
- apertium.html
- The main application.
- codes.json
- For conversion between three-letter and two-letter language code names to prevent duplicates.
- colorbrewer.js
- Interactive graph colorization.
- languages.json
- List of all languages to be represented.
- pairs.json
- Language pair data.
- pairs.json.txt
- Language pair data, used by the main application.
- reset.css
- scrape_repo_information.py
- Run this to update language data.
Known bugs
There are a few apparent bugs that should be fixed before the pair viewer goes public.
- sometimes quz has no line connecting it to spa
- sometimes two- and three-letter codes don't seem to merge
- when just trunk and staging are selected, tur/tr and nob/nb are each separate from one another
- when trunk, staging, and nursery are selected, nob/nb are merged, but tur/tr are separate
- when all possible pairs are viewed (including ones with missing stems, etc.), pa doesn't have a line connecting it to ur

