Debugging C++
Using gdb to debug lttoolbox/apertium
gdb is the GNU Project debugger, which lets you put breakpoints in C++ (and other languages), inspect local variables and so on. It is useful.
To start using gdb, you first have to recompile with the -g option sent to gcc:
<code lang="sh">
$ sh autogen.sh  # ensure autotools are set up
$ make clean     # force a full recompile
                 # these options turn gdb-support on and optimisation off for C, C++ and linking:
$ ./configure CFLAGS="-ggdb3 -O0" CXXFLAGS="-ggdb3 -O0" LDFLAGS="-ggdb3"
$ make
</code>
Most gdb-tutorials will tell you to start gdb like gdb path/to/binary. However, since apertium/lttoolbox uses libtool, files like trunk/lttoolbox/lttoolbox/lt-comp are actually not binaries, but wrapper scripts which ensure the correct libraries are loaded. Since gdb doesn't understand these wrapper scripts, we need to wrap the gdb call with libtool. If you want to debug lt-comp, you start gdb like this (assuming you are in trunk/lttoolbox):
<code lang="sh">
$ libtool --mode=execute gdb lttoolbox/lt-comp
</code>
In Emacs
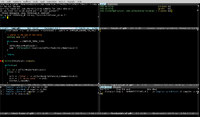
Do M-x gdb and you'll be asked "Run gdb (like this):", change it to say libtool --mode=execute gdb -i=mi lttoolbox/lt-comp and press return. In the main menu, you can click Gud → GDB-MI and tick off Display Other Windows (or type M-x gdb-many-windows to toggle showing of the breakpoint list, local variables, stacktrace etc.
Valgrind
is also cool
