Difference between revisions of "User:Asfrent/Application"
| Line 79: | Line 79: | ||
Let's take a look at the profile (remember, times are measured on the '''-10000''' file, while the profile is done |
Let's take a look at the profile (remember, times are measured on the '''-10000''' file, while the profile is done |
||
on the '''-1000''' input file): |
on the '''-1000''' input file): |
||
[[File:Xfervm-master-profile.png]] |
|||
Revision as of 22:49, 14 March 2014
Contents
Project description
The project aims to speed up the VM for transfer code (the transfer step being the slowest of the translation pipeline at the moment).
High level optimizations
Algorithms and data structures
Look for better data structures and algorithms that will result in a lower complexity of the system. One thing that we could do to the current design is to compress the trie that stores rules (trie compression involves finding path in which the nodes have only one child and compress that path into a single node). The lookup table in each node will be string indexed, allowing the trie to have better search times because less nodes will be explored (although the same number of characters).
We could also introduce supplementary fast links in the trie (in the lookup tables present at each node) by making an analysis of the most common matches that are needed in practice.
Interpreter redesign
A profile of a slightly optimized code shows that a lot of time is spent in the interpreter code in order to convert strings to integers. This is because the interpreter stack has been designed to work with a a single data type (strings), so every time a VM instruction needs integral data types we need to convert the strings.
Instruction set
There are some instructions that take much longer time than others. By analyzing the instruction set we should be able to further fragment these time consuming instructions into smaller ones that will perform faster and could be easier to optimize.
Low level optimizations
Memory allocator
We could design a memory allocator for the VM data structures that will keep related objects (like nodes in a tree) as close as possible one to the other in order to increase the cache hits).
Branch prediction
Some parts can be restructured in order to make use of the branch prediction at the CPU level. I worked a little on some parts of the code that had this issue and gained some speedup using this technique.
Constant pool
The current implementation of the virtual machine spends a lot of time in copying strings from one method to the other. This could be greatly improved by using a string pool.
Caching
Caching can really improve the behavior of the VM - methods that are called often with (more or less) the same parameters can maintain a cache of the results if they do not have any side effects or depend on the global state. In the proof of concept, caching itself made a difference of about 10%.
Reduce copying of the data structures
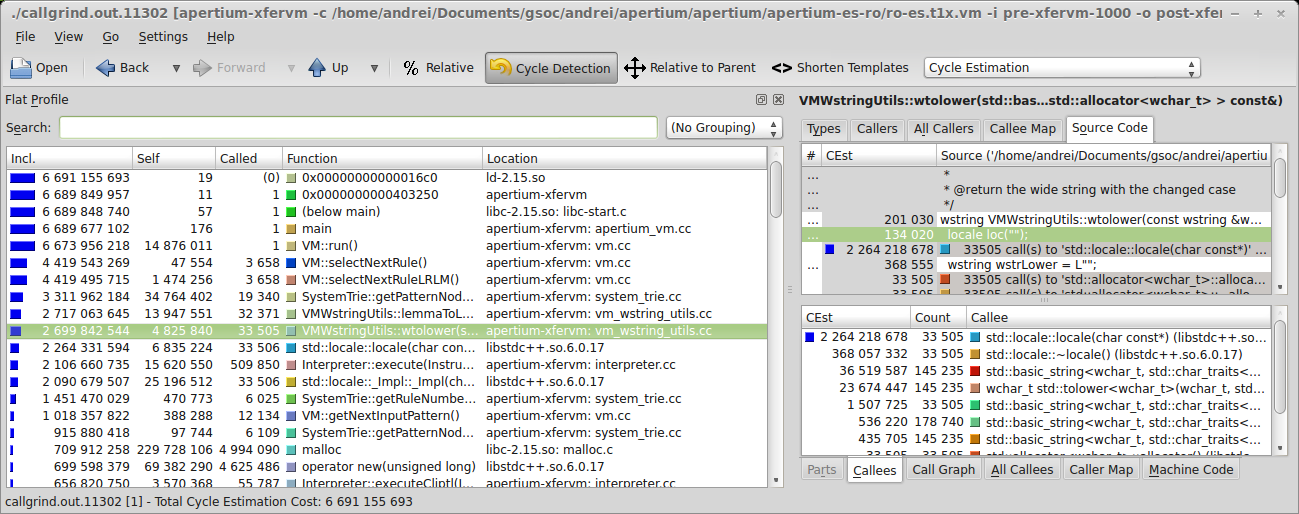
As you will see in the code profiling report below, a lot of time was spent in moving vectors around. This can be avoided by a stricter coding style (marking returned vectors with const& or, when not possible, just using plain references).
Proof of concept
The tools I used to produce the proof of concept were:
- vim - the best editor there is
- valgrind - check for memory leaks
- callgrind (a valgrind tool) - profiling the code
- kcachegrind - GUI for callgrind reports
First I compiled and installed apertium on my machine (using the es-ro pair). I started with a fresh version of VM-for-transfer, by checking out the master branch of the repository. The test files I am using are part of the Parliament Proceedings Parallel Corpus 1996-2011.
In order to properly test the VM, I created two input files, pre-xfervm-10000 and pre-xfervm-1000. Both of them are created by running the first part of the pipeline (until just before the transfer), the only difference is the number of lines that were processed out of the original text (which is given by their suffix). The purpose of the pre-xfervm-10000 file is time evaluation, while the profiling will be done on the smaller one, pre-xfervm-1000, because valgrind takes a lot of time to produce the profiling report.
The fresh version (master branch) of the VM-for-transfer takes about 40s to do the transfer:
andrei@andrei-xps bin $ ./_tm
real	0m40.275s
user	0m40.183s
sys	0m0.052s
Let's take a look at the profile (remember, times are measured on the -10000 file, while the profile is done on the -1000 input file):
